Diagram & Data Visualization

AI diagram tool

AI diagram tool

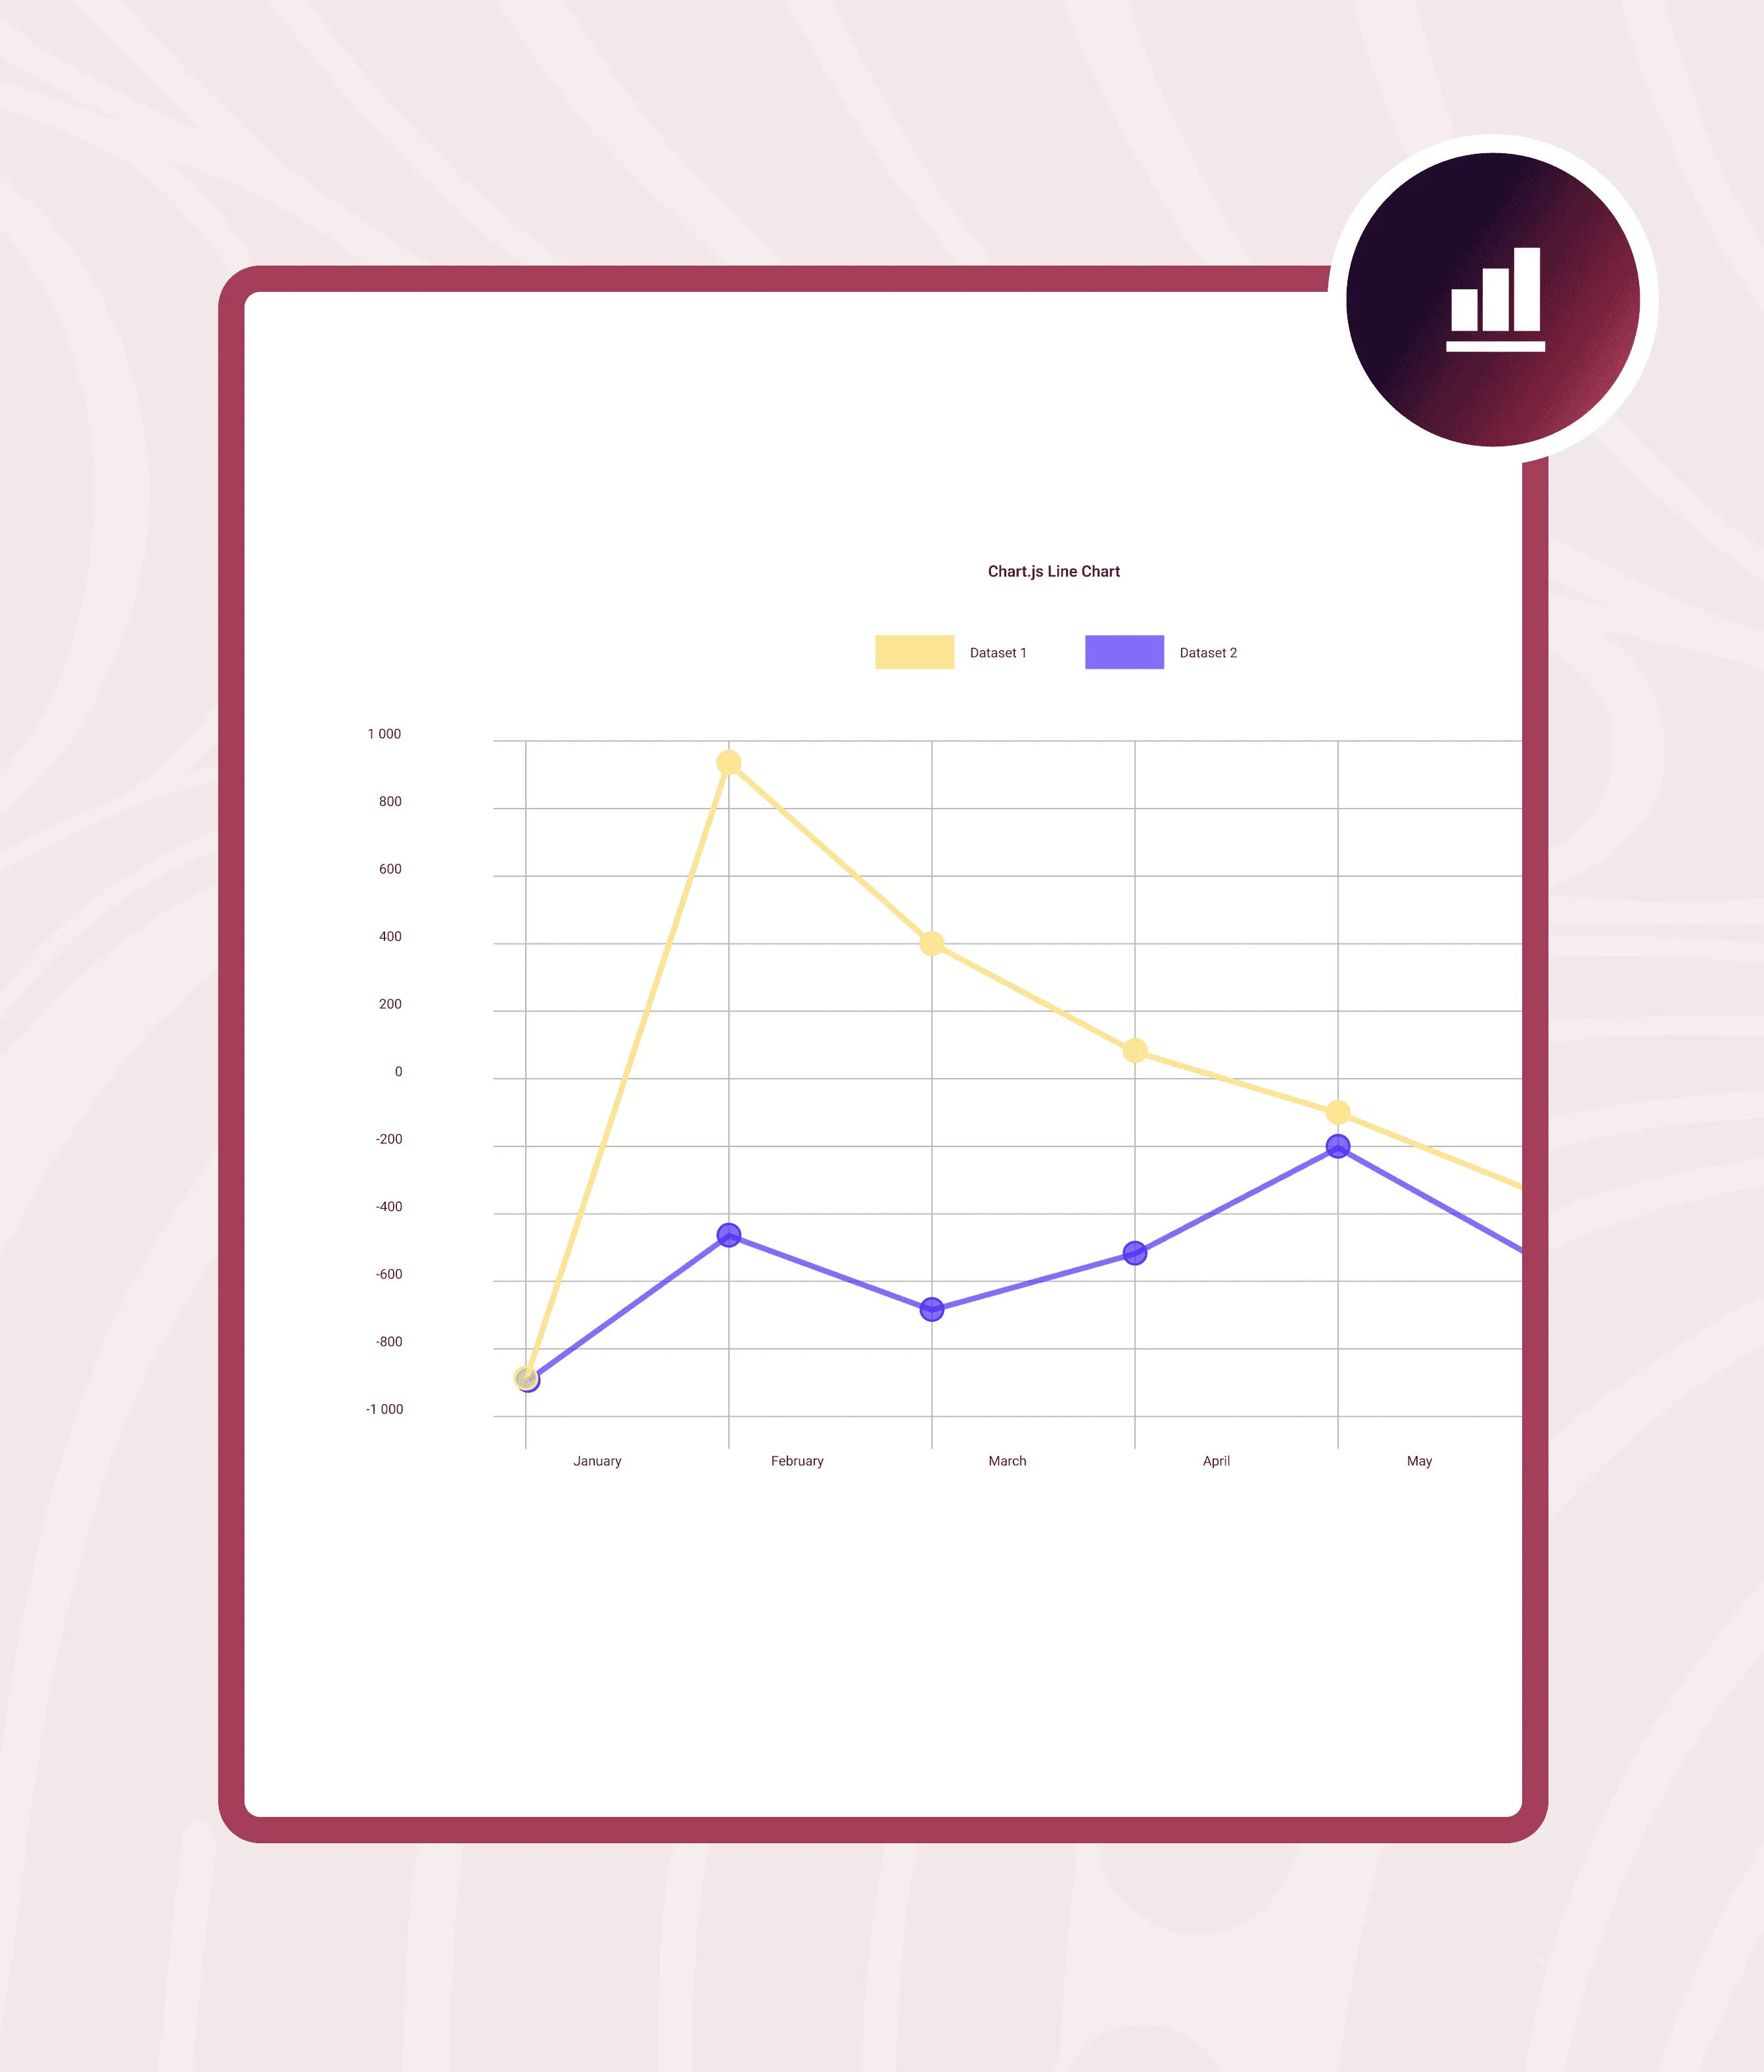
Automatically process comparative data, synthesize theoretical models, and generate publication ready figures.

Automatically process comparative data, synthesize theoretical models, and generate publication ready figures.

Website image

Trusted by 1 Million+ researchers

Website image

Trusted by 1 Million+ researchers

Website image

Trusted by 1 Million+ researchers

Website image

Trusted by 1 Million+ researchers

  • Christopher Newport University
  • SAIT
  • MIT
  • Univeristy of cambridge
  • Penn
  • Stanford University
  • University of Oxford
  • NASA
  • Christopher Newport University
  • McKinsey & Company

Trusted by 1 million+ researchers

  • Christopher Newport University
  • SAIT
  • MIT
  • Univeristy of cambridge
  • Penn
  • Stanford University
  • University of Oxford
  • NASA
  • Christopher Newport University
  • McKinsey & Company

Trusted by 1 million+ researchers

  • Christopher Newport University
  • SAIT
  • MIT
  • Univeristy of cambridge
  • Penn
  • Stanford University
  • University of Oxford
  • NASA
  • Christopher Newport University
  • McKinsey & Company

Diagram tool for comparative analysis

Generate AI Graphs and Tables

Search over 300 million papers or your own sources to accurately depict your research data.
Website image
Website image

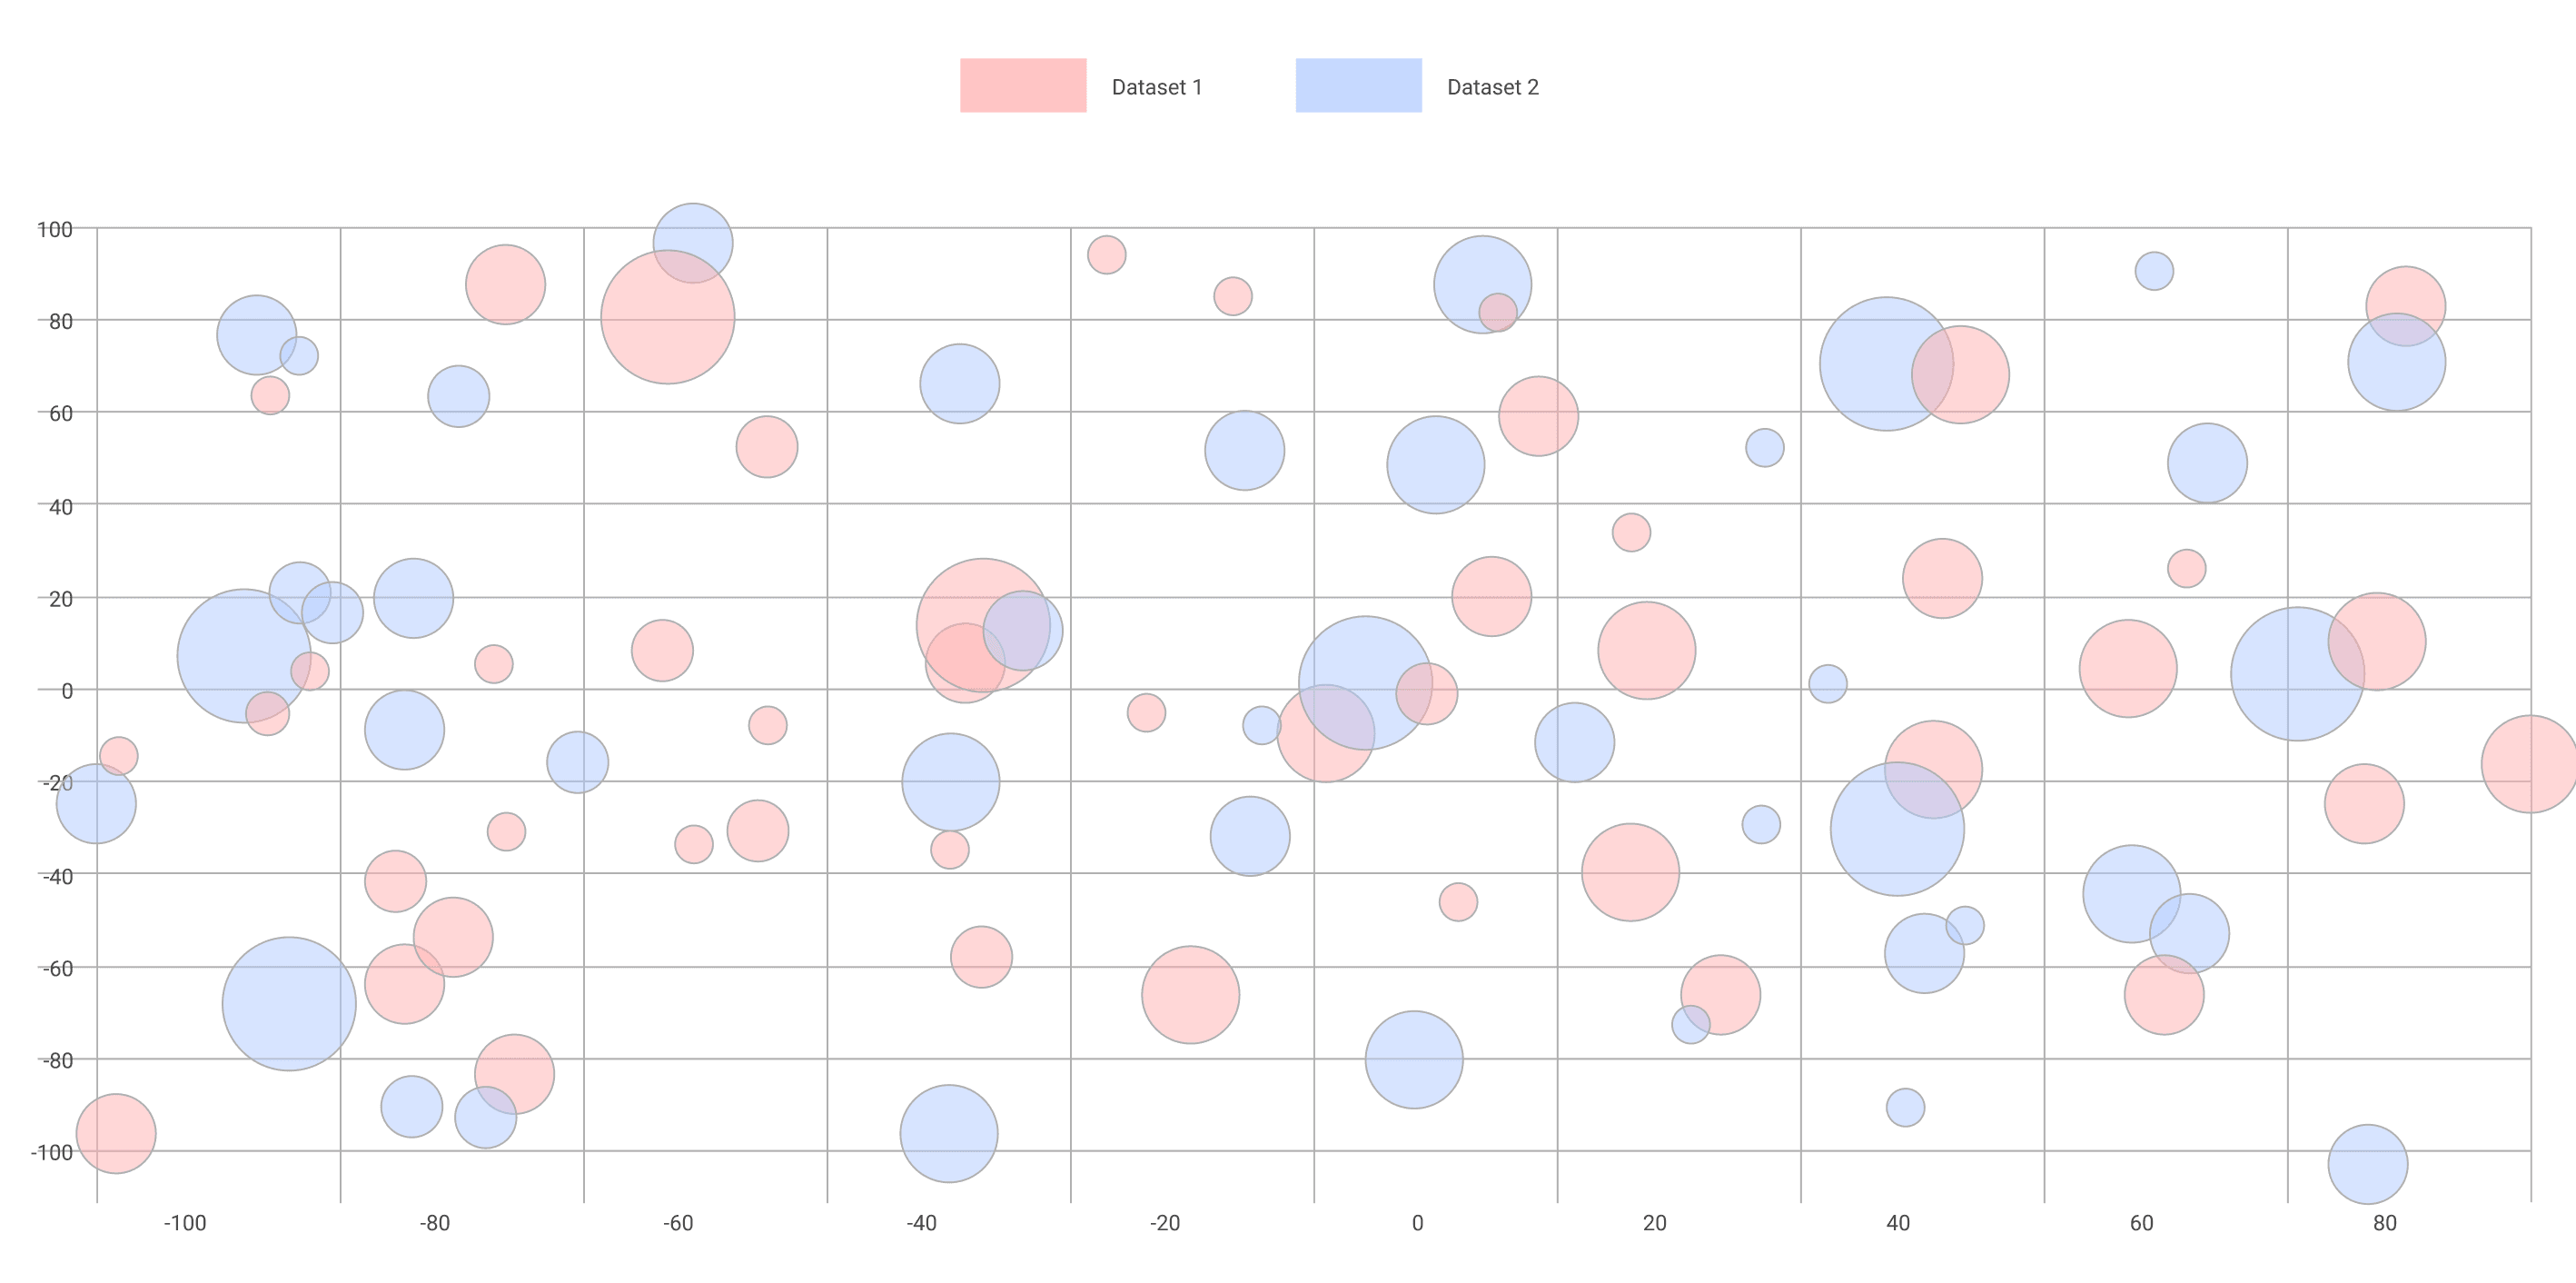
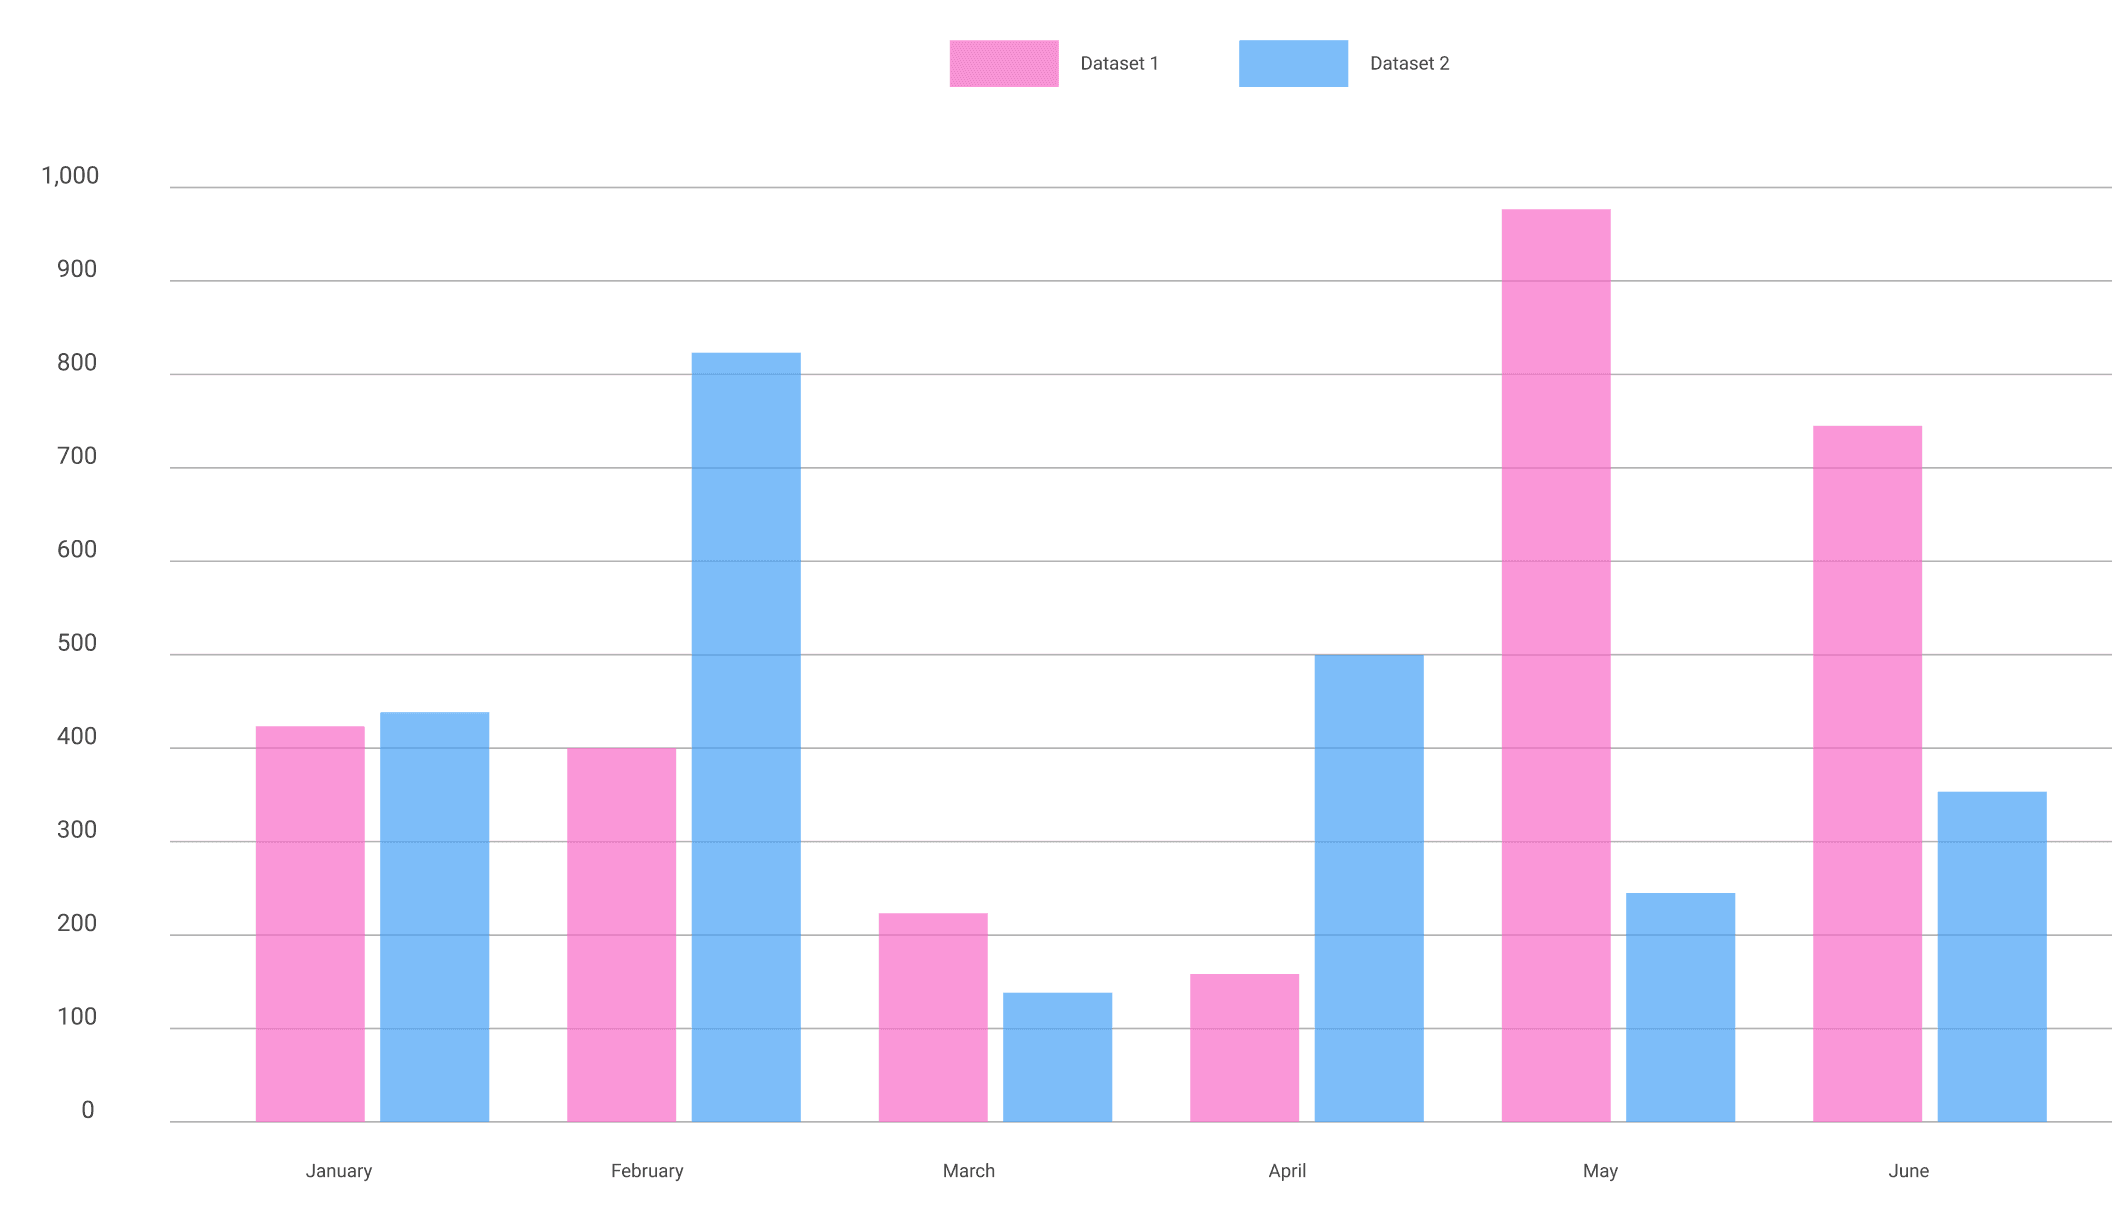
Research Charts in Seconds

Produce bar or pie charts visualizing the frequency of different research methodologies across the literature corpus.

Website image
Website image

Visualize Conflict/Consensus

Generate diagrams that clearly show areas where studies agree versus contradictory findings.
Website image

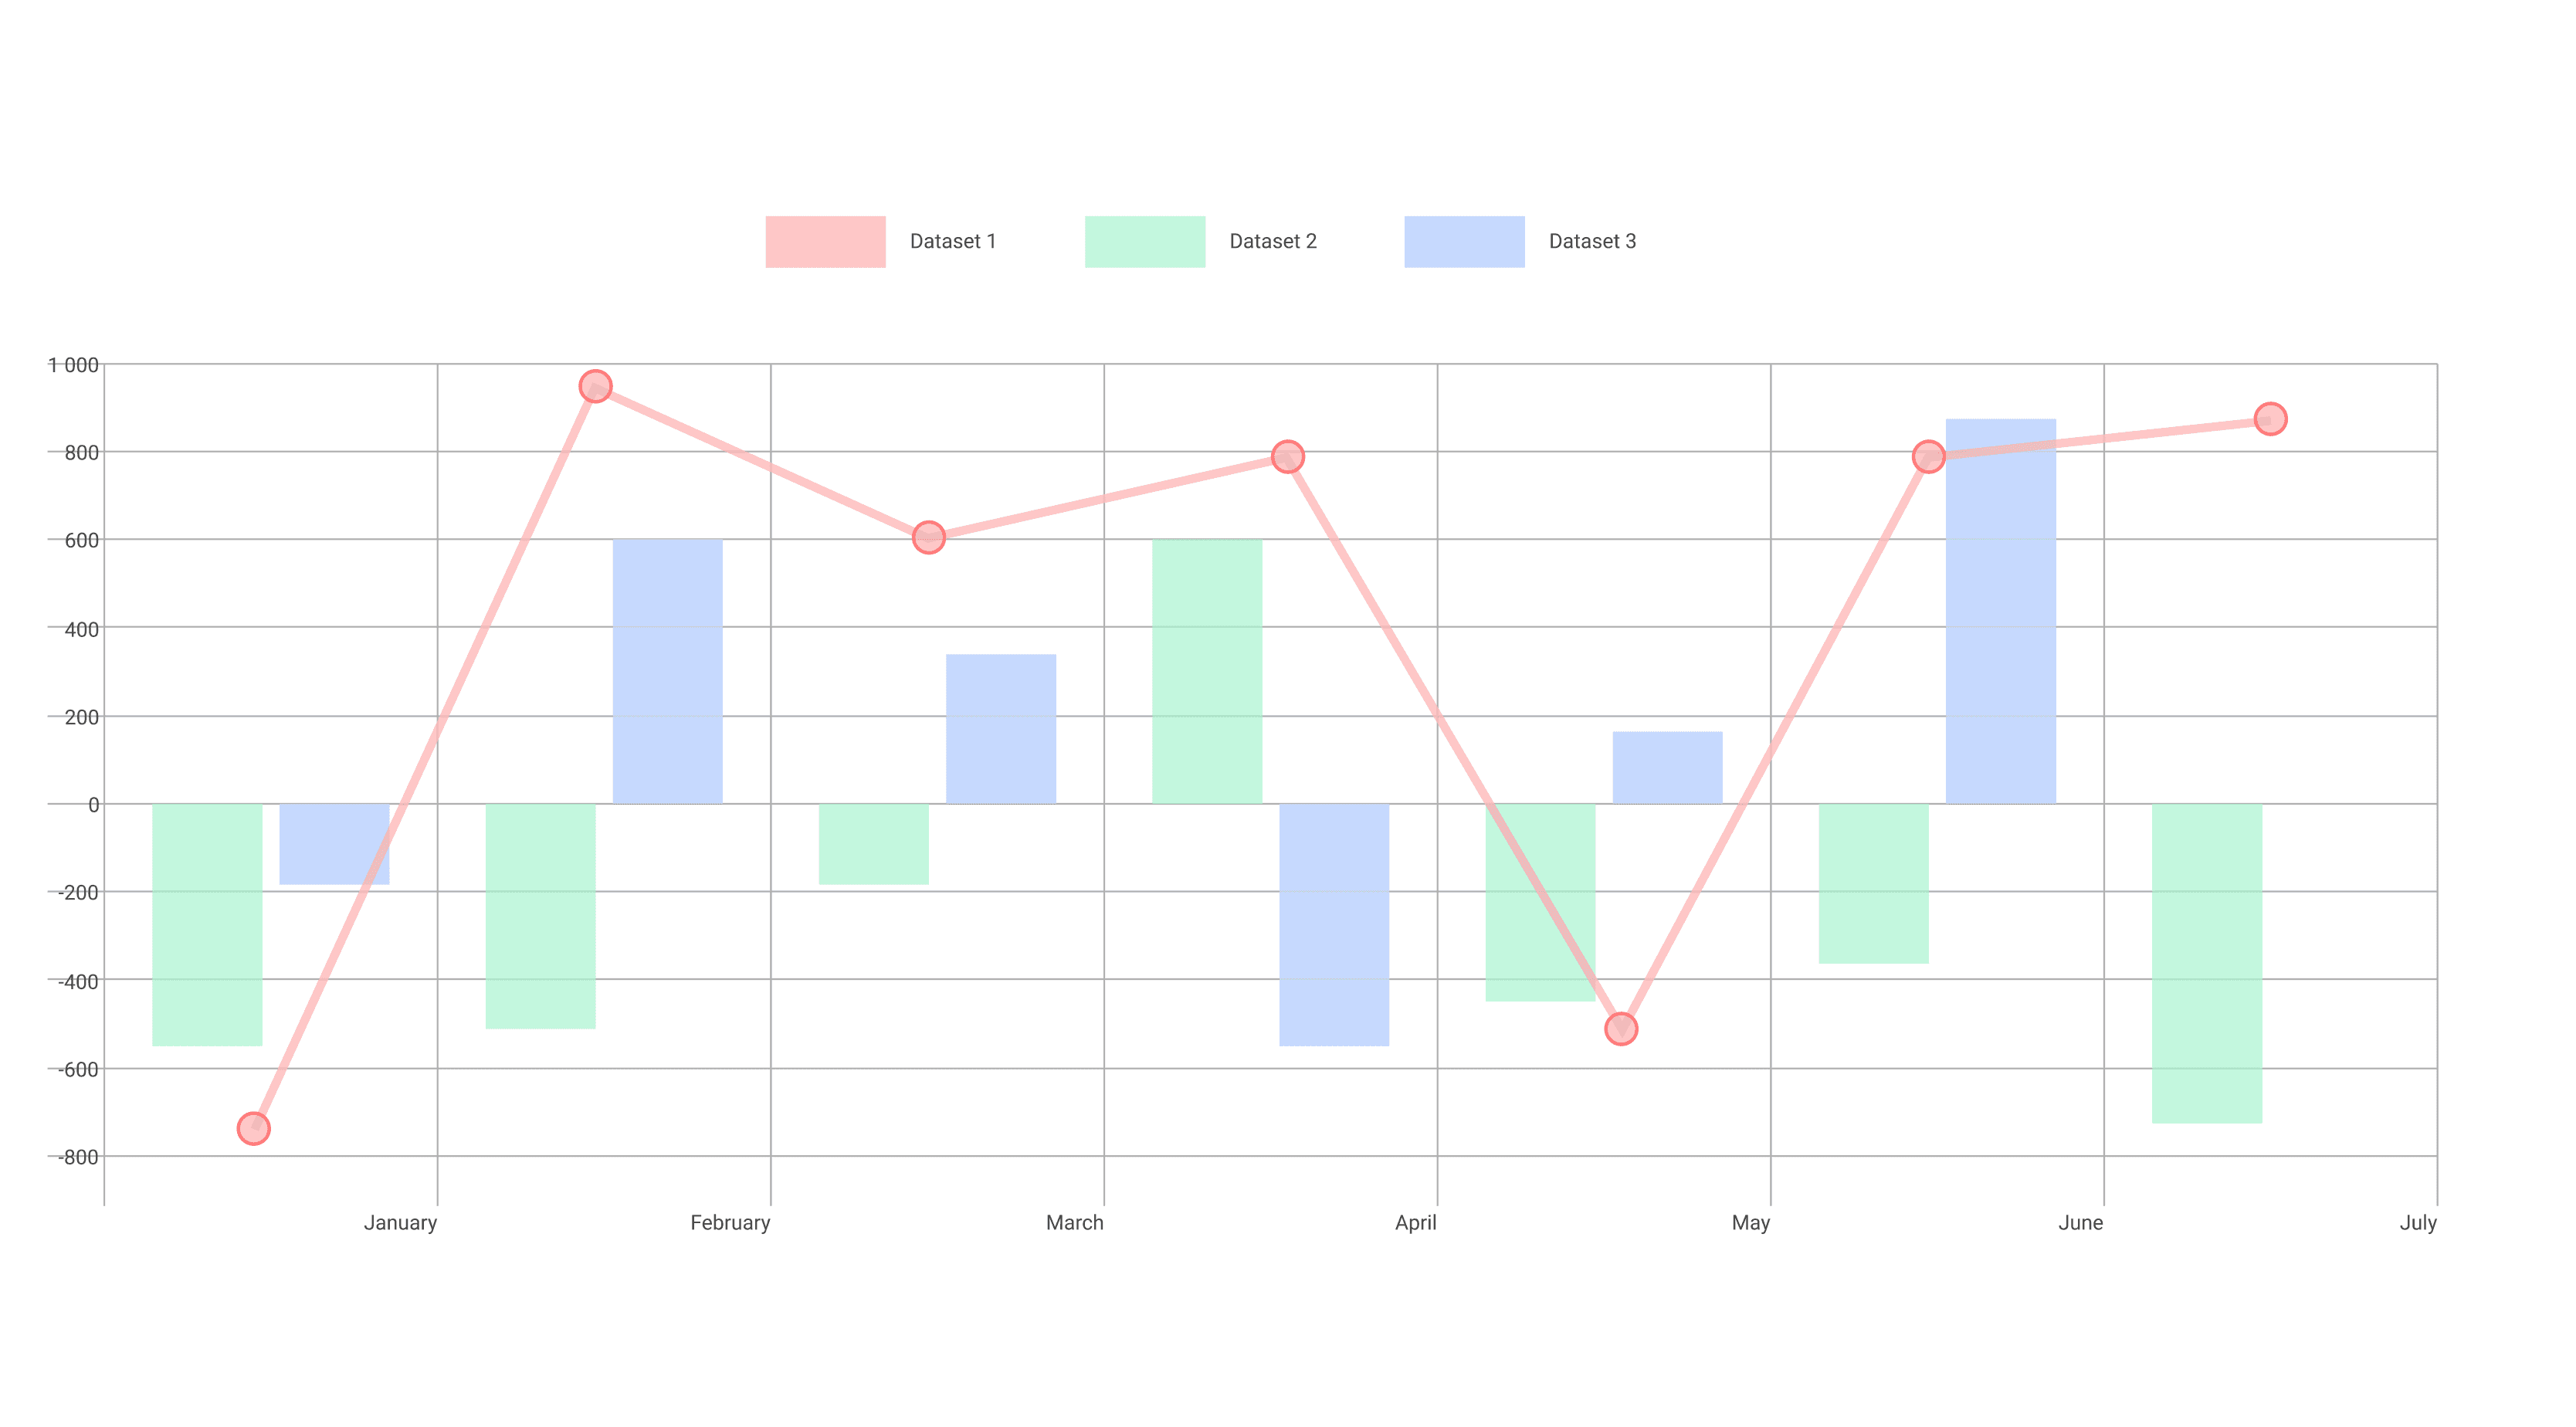
AI Diagrams Highlight Key Statistical Data Points

Use diagrams to create graphs, charts, and visuals that reveal trends and insights other researchers often miss.

Website image

AI Diagrams Highlight Key Statistical Data Points

Use diagrams to create graphs, charts, and visuals that reveal trends and insights other researchers often miss.

Website image

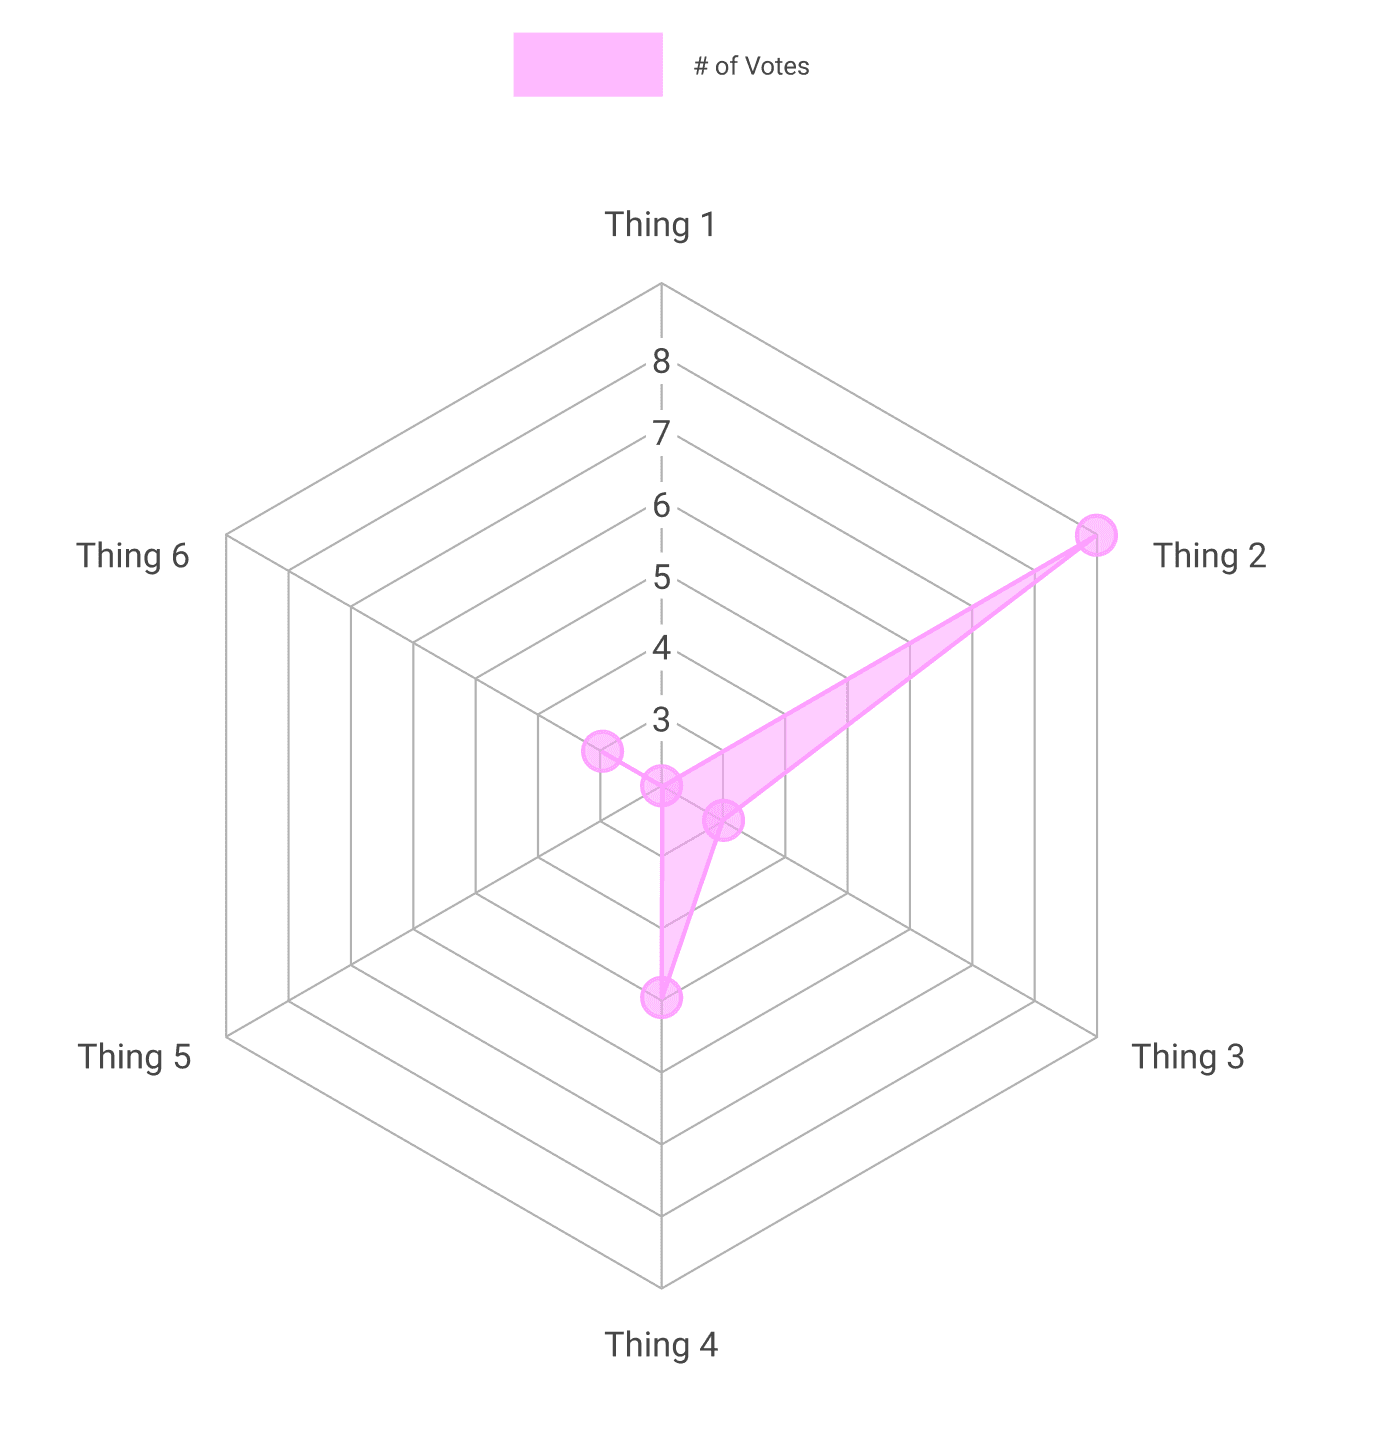
Dynamic AI Diagram Tool For Research

Create any diagram you need from network diagrams, to charts and bar graphs.
Website image

Navigate Your AI Diagrams

Navigate Your AI Diagrams

AI Diagram Interacts With Sources

Upload your PDFs or link Mendeley/Zotero. AI will ensure the literature aligns with your research.

AI Diagram Interacts With Sources

Upload your PDFs or link Mendeley/Zotero. AI will ensure the literature aligns with your research.

Export your diagram

Download the finished diagram and add it to your paper, presentation, or report.

Export your diagram

Download the finished diagram and add it to your paper, presentation, or report.

Add Citations and Finish Your Work

Simply add your literature review to the AI editor and complete your project!

Add Citations and Finish Your Work

Simply add your literature review to the AI editor and complete your project!